Thursday, March 20, 2014

FLOOD AND DEBRIS!!! WATCH OUT!!

Weserville is flooded!!!! There is 10 feet of water everywhere! Damage has been done to almost every home and business in our small town. It even destroyed the main road that lets us get in and out of Weserville. Now you're stuck here... FOREVER O__O
Not that that is a bad thing, Weserville is awesome. It will still cause problems though.
We all know that many things washed away during the flood.... and since the road is broken.... how will the Walmart be built :)


We're still here- Always watching

Everybody waiting for the water to go down (except Koleman who bought a kayak). Most of the people are in their houses safe. Nobody has been reported killed, injured, or missing so everyone should be fine. There was a hedgehog hurt in a non-flood related incident (yeah I mean you Colin). Even after the flood recedes we will all have trouble getting around because of the debris left over from things being swept away in the water. Refrigerators are reported to be everywhere especially. Somehow more fridges that there are houses in Weserville though....

Everyone be safe, don't drown, and stay tuned to the Weserville news in case something else happens!

Thursday, March 13, 2014

What did we do....?

What did we do this week in econ?
All I remember is math..... and graphs......
This was our brains trying to do math.
Probably demand too, we've been doing a lot of demand.
Was Mrs. Weser demanding us to do math?

Yes she was. We practiced using math to figure out the elasticity of demand. We graphed demand and used the price changes and quantity demanded changes to decide if the demand for the product was elastic or not.
There are 2 ways to do this.

Take 2 different points from a demand curve of different prices and where the quantity demanded is for that price.
Calculate the % change of the quantity demanded, and dividing that by the % change of the price. And (somehow) you get elasticity. The lower the number is below 1 is more and more inelastic. Higher than 1 is more and more elastic.

Another way is called the revenue test. You multiply the price by quantity demanded to figure out how much the product made at that price.
If there is a dramatic change in the total revenue then the product is more elastic. If it is about the same then it is inelastic.

The revenue test was much easier to comprehend even though it did not give an exact number for elasticity. It is better for businesses to quickly see if they should raise their prices or lower them slightly to earn more money altogether.

Thursday, March 6, 2014

Curves, schedules, and shifts oh my!

This week in Econ class we learned about demand.
Demand is the willingness and ability for someone to pay for an item. If they can't pay for it or don't want it then the person does not have a demand for it. No matter how much they want it.

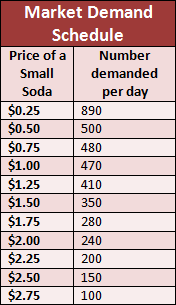
The amount of an item people are willing to buy at various prices can be shown on a demand schedule or a demand curve.
Both show the same information.

Demand schedules display the data in a chart.
 
Demand curves display the data in a graph

That is the only difference. Just how the info is shown.

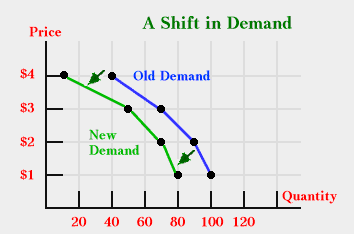
The demand can shift though! Things outside of the price can affect how much people will buy of an item at any price.
There are 6 main things that can cause a shift in demand.

Income- People have more or less money to spend
Market size- Number of potential buyers change
Consumer tastes- Popularity increases demand
Consumer expectations- Possible future prices affect present buying
Substitute goods- Products are interchangeable
Complementary goods- Products are used together

For example: If people have less money to spend on products, then the demand curve will shift because they will be less willing to buy the same amount of a product at all of the prices.
Like this.